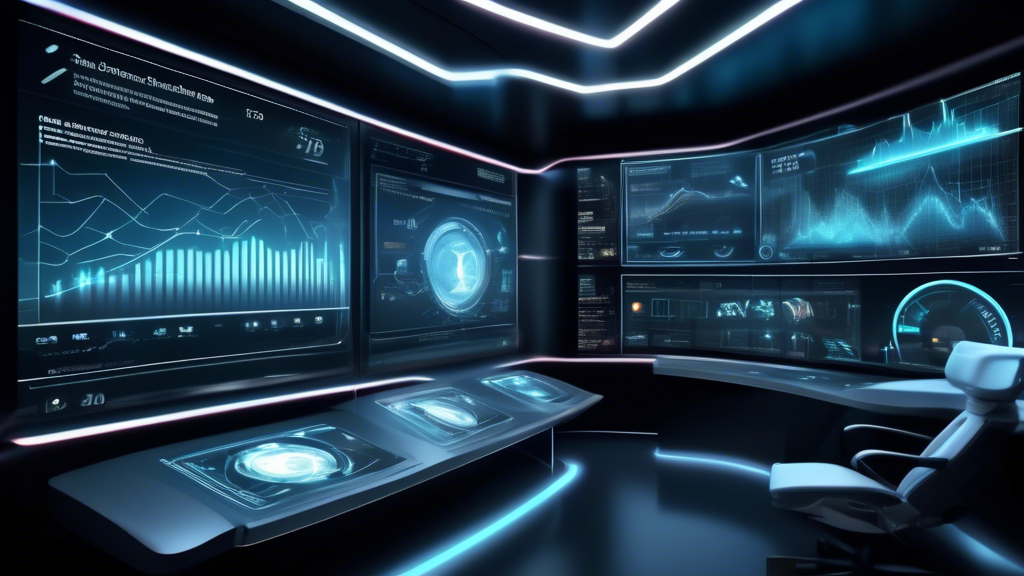
Exploring the Impact and Evolution of Graphical Dashboard Interfaces
Graphical dashboard interfaces are essential tools in data visualization, helping users to quickly understand complex data through visual representation. They are pivotal in various sectors including business, finance, healthcare, and technology. This article delves into the evolution, importance, and future developments of graphical dashboard interfaces.
Understanding Graphical Dashboard Interfaces
Graphical dashboard interfaces display data graphically, allowing users to see patterns, trends, and outliers easily. These interfaces are designed to provide real-time monitoring of data metrics by aggregating and extracting valuable insights from vast amounts of data. Common elements include charts, gauges, and maps.
The Evolution of Graphical Dashboards
From their inception in the mid-1980s, graphical dashboards have evolved significantly. Early versions were primarily used in manufacturing for monitoring production processes. By the late 1990s, advancements in software development spurred their wider adoption. Companies like Dundas and Tableau were pioneers, introducing more interactive and customizable interfaces.
Key Components
Today’s graphical dashboards are made up of several key components:
- Charts: Including bar, pie, and line charts, which simplify complex information.
- Filters: Allowing users to manipulate data to view specific metrics.
- Real-Time Data: Interfaces that refresh automatically to provide live data.
Impact on Decision Making
Dashboard interfaces dramatically impact decision-making processes. In business, they provide a comprehensive snapshot of performance, guiding strategic business decisions. In healthcare, dashboards support clinical decisions by providing real-time patient data to practitioners.
Customization and User Interface Design
Effective dashboard design focuses on simplicity and user engagement. Customization options enable users to tailor layouts to meet personal or business needs, enhancing usability and effectiveness. Simplistic design with intuitive navigation is paramount in modern dashboard interfaces.
Future Directions
The future of graphical dashboard interfaces lies in augmented analytics and AI integration. Anticipate adaptive dashboards with predictive analytics capabilities and enhanced personalization. AI tools can offer deeper insights through data correlations and anomaly detection, driving further efficiency in data handling and rendering.
Conclusion
Graphical dashboard interfaces continue to revolutionize the interpretation and strategic value of data across industries. As technology advances, their role in decision-making processes becomes more ingrained in daily operational tasks, offering clearer insights with less human intervention.

